|
|

Photo From: Tom Hemmick - Album: General
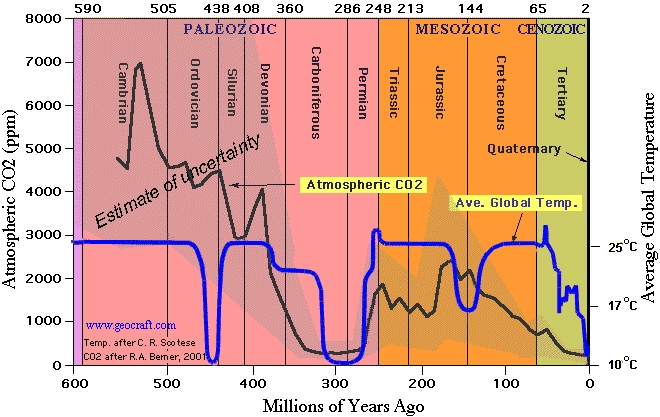
Description: For anyone interested in longer climate time frames, here's in interesting graph. Its been used in some presentations, for example by Professor Tim Ball, a Canadian scientist. Blue line show historic temp trend line. black line is CO2 in the atmosphere. Uploaded: 4/18/2015 by Tom Hemmick
Comments on this Image: (Be first to comment.)
You must be registered user and logged in to comment.
Login or Register and you will be returned to this image page.
Login or Register and you will be returned to this image page.


